Software Developer · Data Science & Analytics

Hi, I'm Rishi Balodi

I build intelligent, data‑driven software experiences—from AI‑powered web applications to analytical dashboards that turn raw data into clear, actionable insights.

About

Who I am and what I love building.

I am a Computer Science student at Lovely Professional University with a strong interest in building intelligent software systems and solving real-world problems.

I have experience in programming languages such as C, C++, Python, and Java. I also work with machine learning tools and data analysis techniques to build efficient and scalable applications.

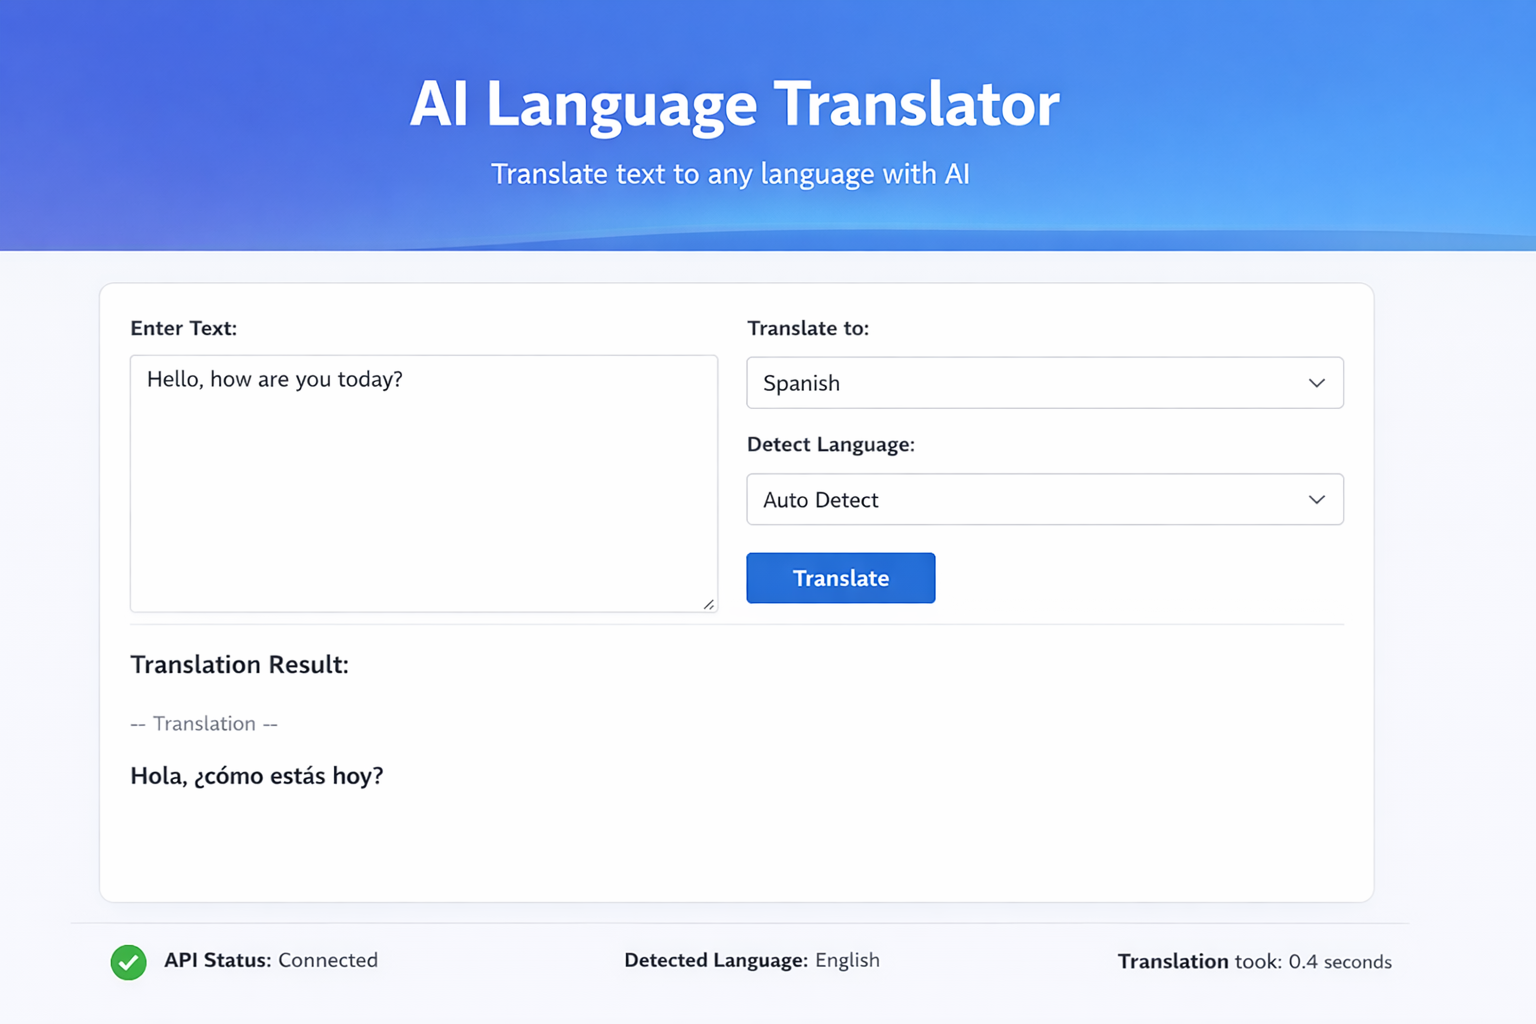
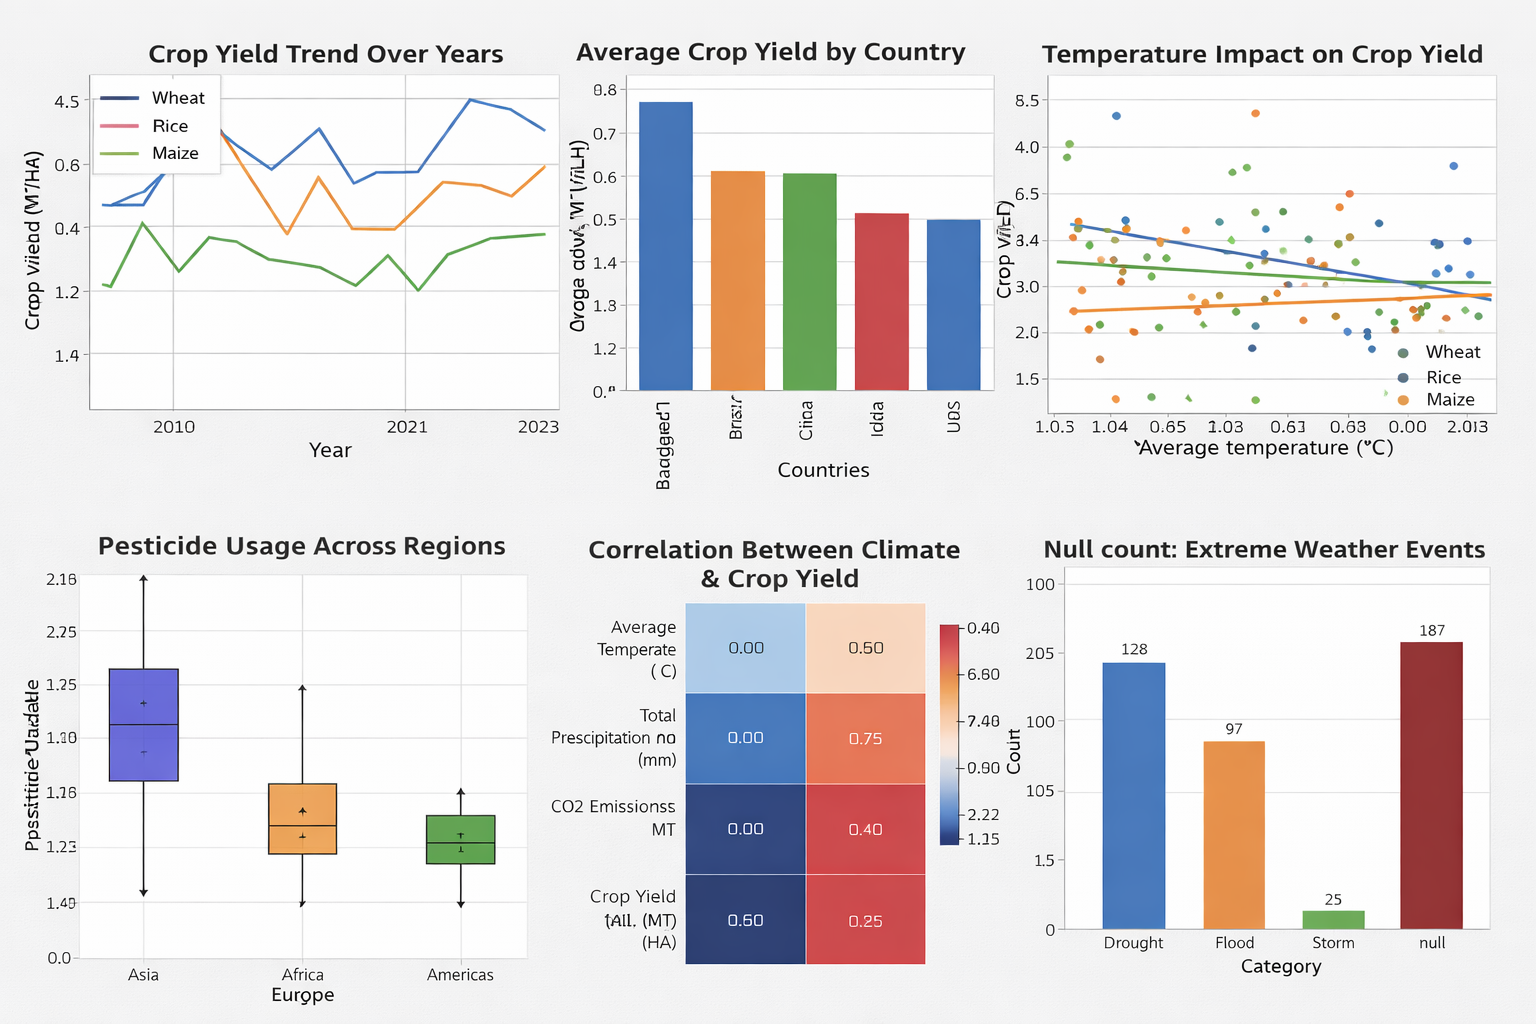
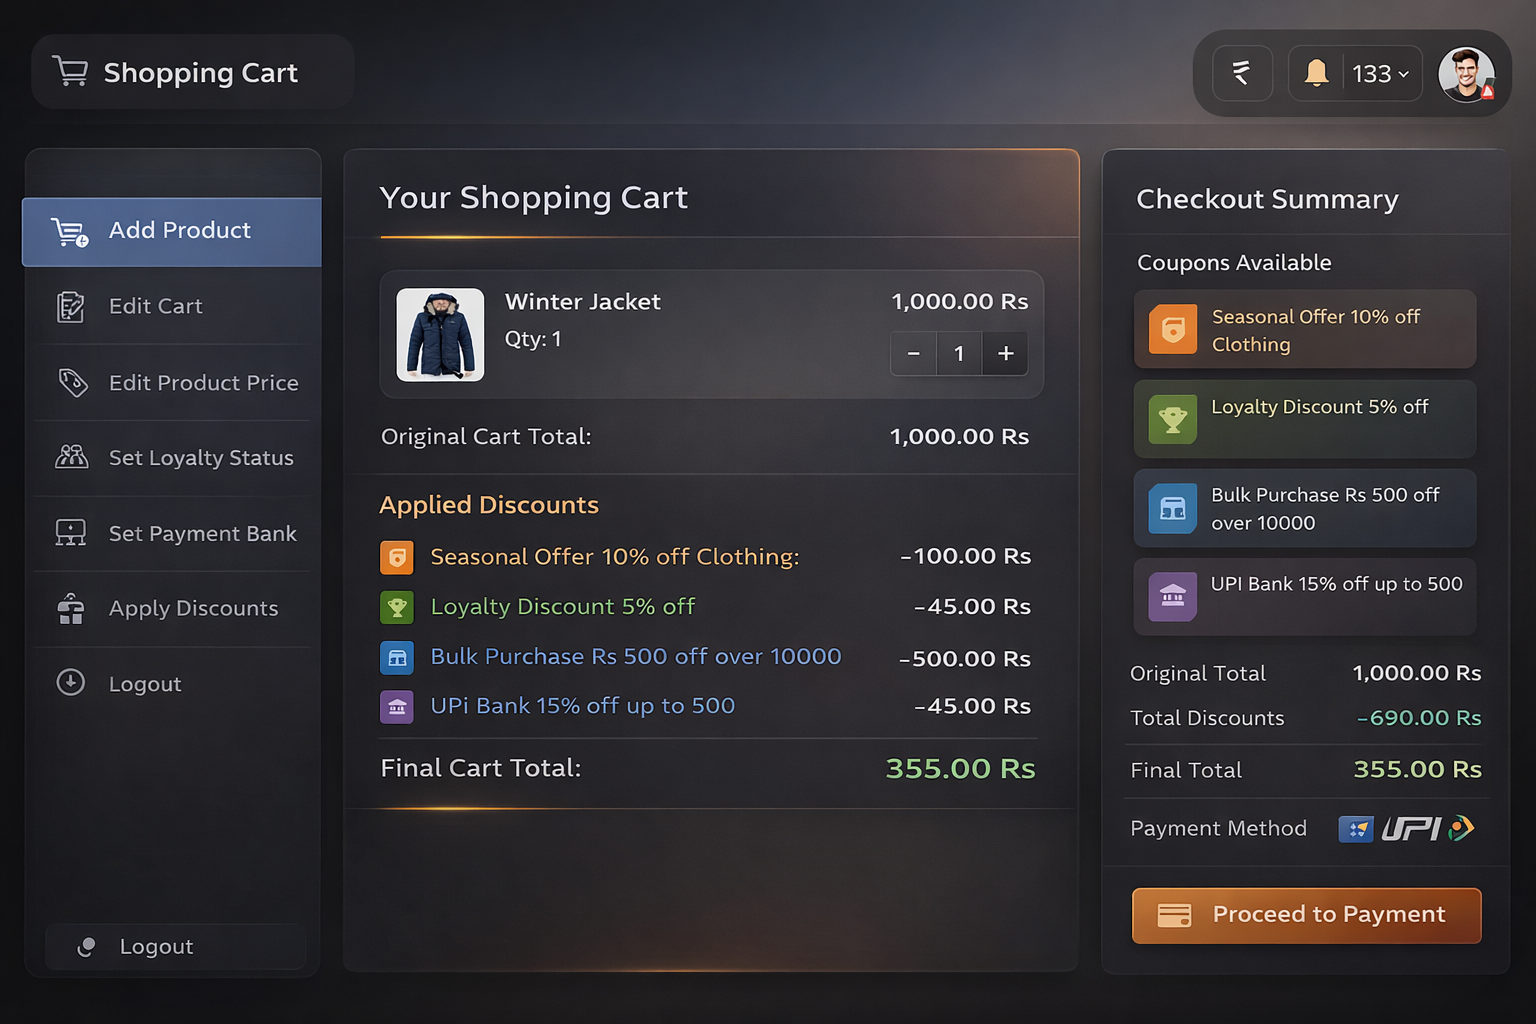
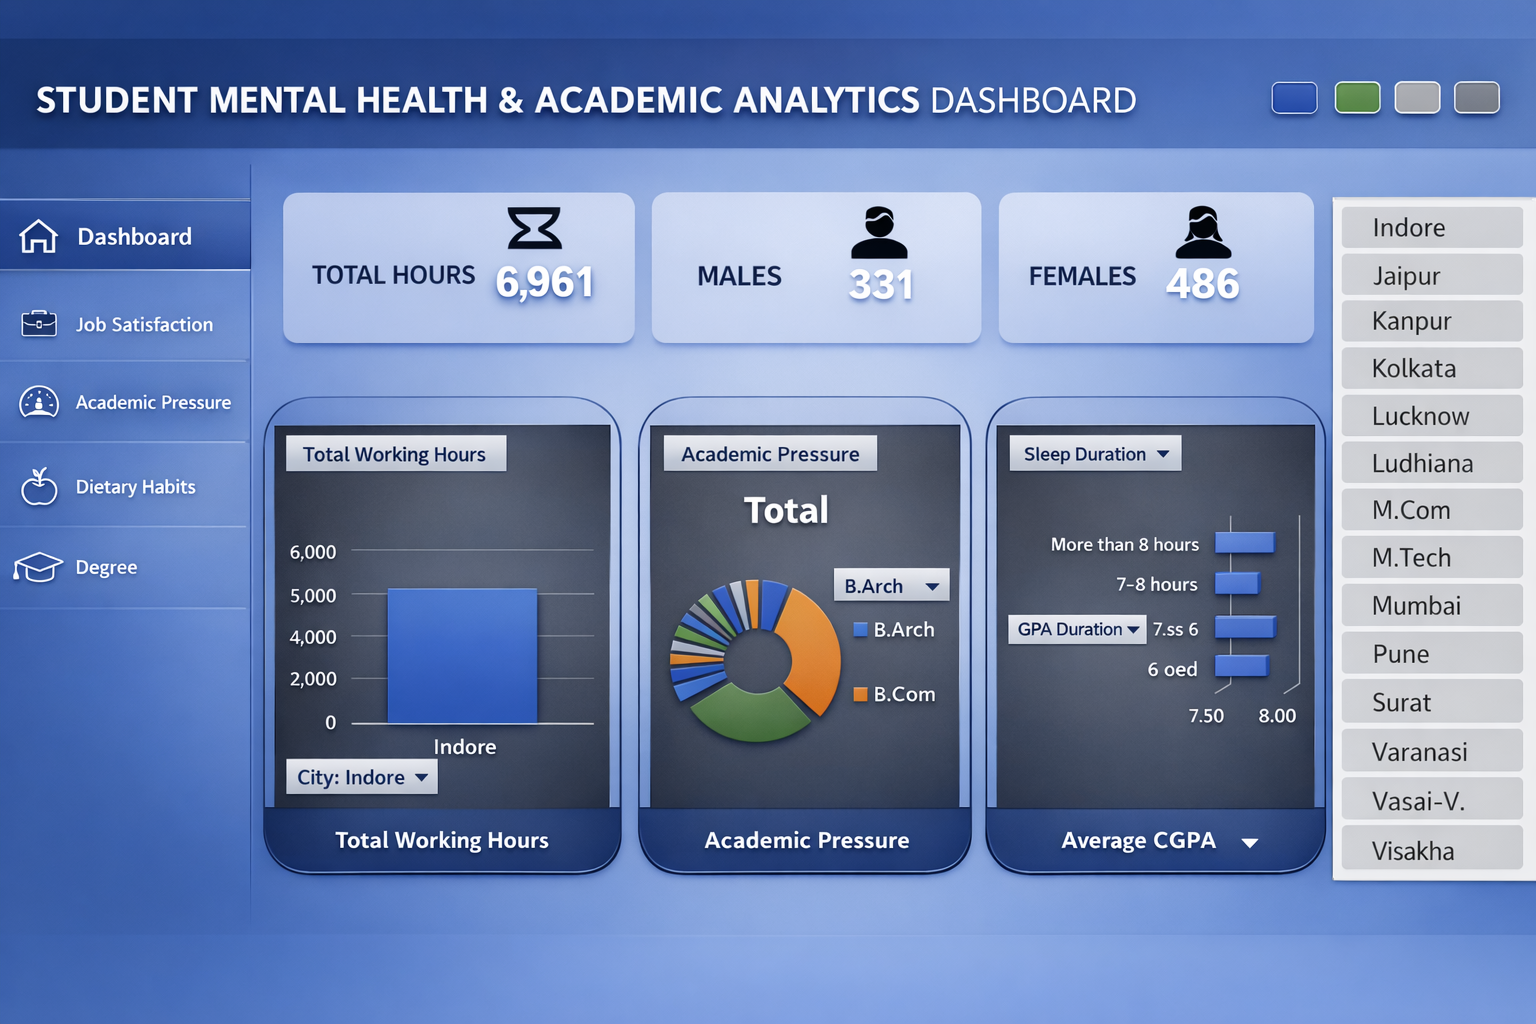
As a software developer and data science enthusiast, I enjoy working on projects involving AI, data visualization, and modern software architecture—from intelligent web applications to data-driven analytics dashboards.

Based in India
Focus AI & Data-driven systems
Current Computer Science @ LPU

Skills & Tools

A snapshot of the technologies, platforms, and strengths I use to ship reliable, data‑driven solutions.

Core skill areas

I work across the stack—from low‑level C++ and Python for algorithms and data science, to SQL, dashboards, and cloud‑ready tooling that make insights easy to act on.

Languages Data & ML Databases DevOps & Tools Soft Skills
C / C++ Advanced
Java Intermediate
Python Advanced
Data & ML (TensorFlow, Scikit‑Learn, Pandas, SciPy) Applied
SQL & MySQL Strong
Power BI & Advanced Excel Analytics‑focused
Git / GitHub Daily driver
Linux & Docker Working
Soft skills Team‑ready
Problem solving Team collaboration Adaptability

Education & Achievements

Academic journey, certifications, and milestones that shape how I think about engineering and data.

B.Tech — Computer Science & Engineering

📍 Punjab, India 🗓️ Aug 2023 — Present
7.16 CGPA

Focused on software development, cloud infrastructure, and data science. Active in coding, problem solving, and building data‑centric projects that combine AI and analytics.

Software Engineering Data Science AI & ML

Intermediate — Science (12th)

📍 Kotdwara, Uttarakhand 🗓️ Apr 2021 — Mar 2022
72.2% Score

Completed senior secondary education with a science stream, building a strong foundation in mathematics and physics.

Mathematics Physics Chemistry

Matriculation (10th)

📍 Kotdwara, Uttarakhand 🗓️ Apr 2019 — Mar 2020
84.4% Score

Achieved a strong academic base across all subjects, with emphasis on mathematics and science.

Top Scorer Science & Math

Highlights

  • Sharpened problem‑solving skills by consistently practicing coding questions on platforms like LeetCode and GFG.
  • Completed hands‑on projects that combine AI, data analysis, and clean software design patterns.
  • Comfortable presenting technical work through structured reports, dashboards, and project documentation.

Certificates

Click a certificate to preview the original document.

Projects

Selected work across AI, data, and software design.

Screenshot of AI multilingual translation web app interface

AI Multilingual Translation Web App

A Flask web application that performs real-time language translation using Gemini API. It automatically detects the input language and translates it into multiple languages using structured REST API requests and secure backend integration.

Flask Gemini API REST AI
Charts and visualizations from climate change data analysis project

Climate Change Data Analysis

A Python data analysis project exploring the impact of climate change on agricultural productivity. The project performs data preprocessing, exploratory data analysis, and visualization using libraries like Pandas, NumPy, and Matplotlib.

Python Pandas NumPy Matplotlib
Shopping cart discount system UI showcasing applied offers and checkout summary

Shopping Cart Discount System

An object-oriented shopping cart system built using C++. It implements design patterns such as Strategy and Chain of Responsibility to support flexible discount rules and modular pricing logic.

C++ OOP Design Patterns
Excel-based business analytics dashboard with KPIs and interactive charts

Excel Data Dashboard

An interactive business analytics dashboard built using Microsoft Excel. It uses pivot tables, charts, and automated calculations to visualize business performance and key insights.

Excel Dashboards Analytics

Resume

A concise view of my journey as a software developer and data-focused problem solver.

Download my CV to explore my academic background, software development experience, and hands-on work across AI, data science, and analytics projects.

View CV

Contact

Let’s talk about ideas, collaborations, or opportunities.

This demo form does not send emails yet.